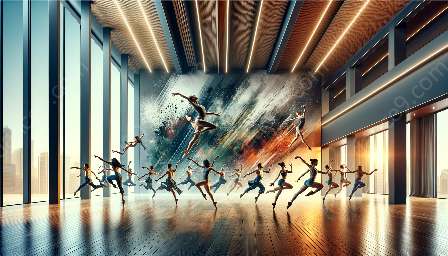
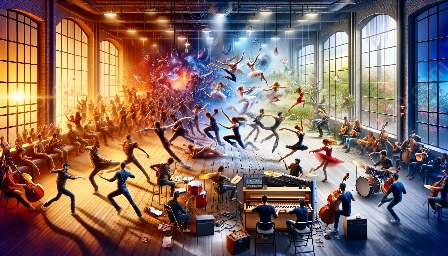
As the intersection of technology and art, data visualization presents exciting opportunities for inspiring choreography. This comprehensive guide delves into the connection between data visualization, choreography, and the tools that empower creative expression.
Data Visualization in the Context of Choreography
Choreography is a form of artistic expression that relies on creativity, movement, and storytelling. Data visualization, on the other hand, is the graphical representation of information and data. The fusion of these two distinct disciplines offers unique potential for choreographers and dancers to find inspiration in new and unexpected ways.
Enhancing Creativity with Data Visualization
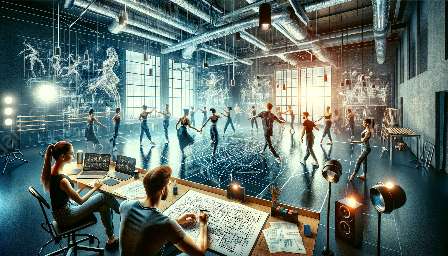
By harnessing the power of data visualization, choreographers can gain fresh perspectives and insights into movement patterns, rhythms, and spatial relationships. Visualizing data sets related to human behavior, environmental factors, or cultural trends can ignite the creative process and lead to innovative choreographic concepts.
Tools for Choreography and Data Visualization
Several cutting-edge tools and software have emerged to facilitate data visualization for choreographic inspiration. From interactive dashboards to immersive virtual reality experiences, these tools provide choreographers with dynamic ways to explore and interpret data through visualization.
Interactive Dashboards
Interactive dashboards empower choreographers to manipulate and engage with data in real-time, uncovering connections and patterns that inform their creative decisions. These platforms offer customizable visualizations that can be tailored to suit various choreographic styles and themes.
Virtual Reality Environments
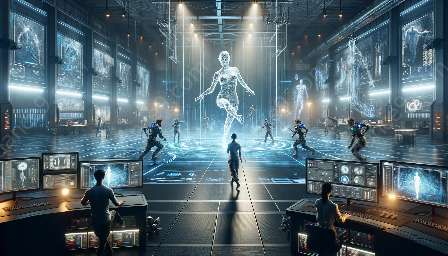
Virtual reality (VR) environments allow choreographers to enter immersive worlds where data visualization becomes a multisensory experience. By visualizing data in 3D spaces, choreographers can gain a deeper understanding of the relationships between movement, music, and visual elements.
Augmented Reality Applications
Augmented reality (AR) applications bring data visualization directly into the choreographic process, overlaying visualizations onto physical spaces or performers. This seamless integration of data and movement opens up new possibilities for creating interactive and dynamic performances.
Case Studies in Choreography and Data Visualization
Real-world examples demonstrate the impact of data visualization on choreographic inspiration. Through case studies, choreographers can learn from successful applications of data visualization in creating compelling and innovative dance works.
Data-Driven Collaborations
Choreographers collaborating with data scientists and visualization experts are pioneering new approaches to dance creation. By leveraging data-driven insights, these collaborations blur the lines between art and science, resulting in boundary-pushing choreography that captivates audiences.
Visualizing Music and Movement Data
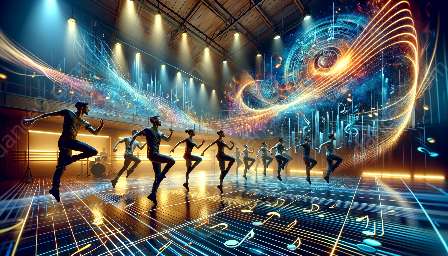
Data visualization tools enable choreographers to explore the connections between music and movement, visually mapping rhythms, tempo, and dynamics. This intersection of data visualization and choreography opens up avenues for creating synchronized and harmonious dance compositions.
Embracing Innovation in Choreography
As technology continues to advance, the fusion of data visualization and choreography is poised to inspire new forms of artistic expression. By embracing innovative tools and approaches, choreographers can unlock the potential of data visualization to inform, enrich, and elevate their creative vision.
